Total Harmonic Distortion
What is THD and how is it measured?
THD stands for Total Harmonic Distortion and can be used to estimate the degree to which a system is nonlinear. A THD measurement can be made by applying a sine wave as an input to a system, and measuring the total energy which appears at the output of the system at harmonics of the input frequency. A sinusoidal input is used because sinusoids contain energy at only a single frequency; output energy that appears at any other frequency is thus the result of nonlinearities or time-varying system behavior. Energy that appears exactly at harmonics of the input frequency is almost certainly generated by nonlinearities in the system. Other periodic test signals or broadband signals are not ideal for THD measurements, because energy contained in the input signal can mask energy created by nonlinearities in the system. It is therefore important to have a pure input signal, i.e., one that has almost all of its energy contained at a single frequency
In order to perform a true THD measurement, energy must be measured separately at harmonics of the input signal. Amplitudes at each harmonic frequency are squared, and then summed. The square root of the sum is the value of THD. Sometimes, this value is presented as a fraction (percentage) of the input signal’s amplitude. In order to make the THD measurement possible, only a finite number of harmonics can be considered in the measurement. For mild nonlinearities, it is usually the case that energy falls off at higher harmonics, so that most of the THD energy is contained in the low harmonics. For severe nonlinearities, many harmonics must be included in order to obtain an accurate measurement.
In most cases, the amount of THD will depend on the amplitude of the input signal. For systems that saturate, it is to be expected that THD levels will increase with increasing signal amplitude. For systems with crossover distortion, it is possible that relative THD levels will fall with increasing input amplitude. Figure 1 shows input and output signals for a nonlinear system. The input signal is a pure sinusoid, while the output signal has several low-order distortion components totaling about 31% THD. On the right-hand side, spectra for the input and output signals are plotted. This system has no additive noise or modulation mechanism, so all energy at the output is contained at harmonics of the input frequency.
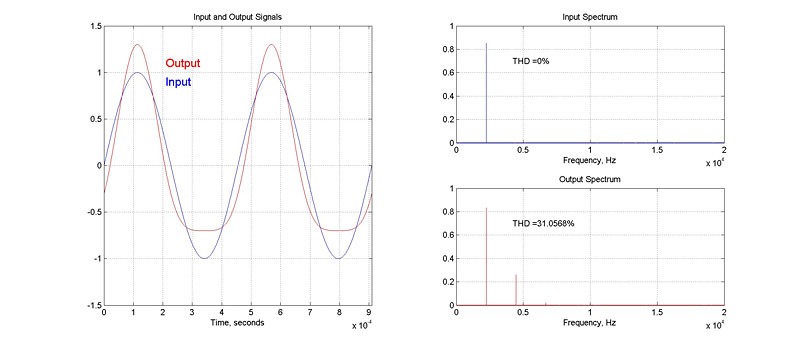
Figure 1: Block diagram for flanger and phaser
Many times, an estimate for THD is obtained by making what is called a Total Harmonic Distortion plus Noise, or THD+N measurement. THD+N figures are obtained by measuring the total energy present in the output, excluding energy at the input frequency. Usually, this measurement is accomplished by passing the system output through a notch filter, which eliminates energy at the input frequency, and measuring the total energy at the output of the notch filter. If it is expected that nonlinearities are the major sources of out-of-band energy, there will only be significant energy at harmonics of the input frequency. Therefore, the notch filter will be adequate if it has significant rejection at the input frequency, and is narrow enough to have nearly unity gain at the second harmonic of the input frequency.
“In order to perform a true THD measurement, energy must be measured separately at harmonics of the input signal.”
THD+N measurements can be made more simply than THD measurements, because energy at multiple frequencies does not have to be calculated separately. Because THD+N measurements include a continuous spectrum rather than discrete (harmonic) spectral points, THD+N figures reflect system noise, crosstalk, and interference at the outputs, as well as nonlinearities. Because of this, THD+N can be used as an overall figure of merit for a system.
For THD+N figures dominated by noise, relative measured values can be expected to decrease as signal amplitude grows. For measurements dominated by nonlinearities, relative measured values will increase with signal amplitude. For systems that produce both noise and nonlinear distortion, a minimum THD+N figure will be obtained at an input amplitude that produces an output comfortably above the noise floor, but below the levels at which significant distortion occurs.
Figure 2 shows input and output waveforms for a nonlinear system with an additive noise component. The upper right-hand plot shows the log-spectrum of the output waveform. The noise floor for the system can be seen along the bottom of the plot. The lower right-hand plot shows figures for THD and THD+N. The THD figure is not really affected by the presence of noise, having a value similar to that shown in Figure 1. However, the THD+N shows a higher value due to the broadband energy contained in the noise.
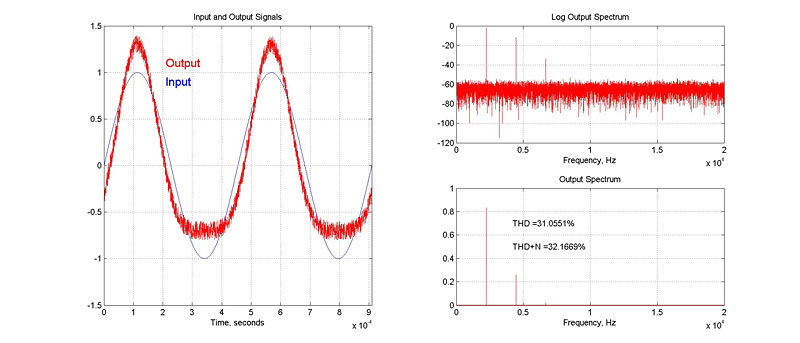
Figure 2: Transfer function for flanger’s delay element
A related measure of distortion is the IMD, or Intermodulation Distortion measurement. IMD is measured by using the sum of two or more sinusoids as an input signal. Typically, the frequencies combined in the input are not harmonically related. With multiple frequencies present at the input, system nonlinearities produce distortion products at sums and differences of multiples of the input frequencies. Thus, rather than being harmonically related, IMD components are separated by the lower of the two input frequencies. This is convenient, because it allows for examination of many distortion components in a narrow bandwidth. With THD techniques, it is necessary to use low frequency input signals to create multiple distortion components in a narrow band. If the system being measured does not support low frequencies, THD measurements then become difficult.
See Audio Precision’s “Audio Measurement Handbook” by Bob Metzler, available for download, for more information on THD and THD+N.
*All trademarks property of their respective owners. Use of artist names does not constitute endorsement of Universal Audio products.
Get more articles delivered to your inbox
Read More
See All ArticlesA Guide to Distortion for Home Recordists
The most misunderstood effect in audio production? We break down the key uses and terminology.
The Plug-Ins You Didn't Know You Needed
Black Box Analog Design HG-2 and elysia karacter are now available for Apollo.
How Apollo's Unison Technology Changes the Way You Record
Hear yourself with studio sound in real time, so you have confidence and your recordings have character.